How Rhize works
This article provides a high-level overview of how Rhize works, starting with data collection and ending with user interaction. To make these concepts more concrete, the next section provides examples of each process.
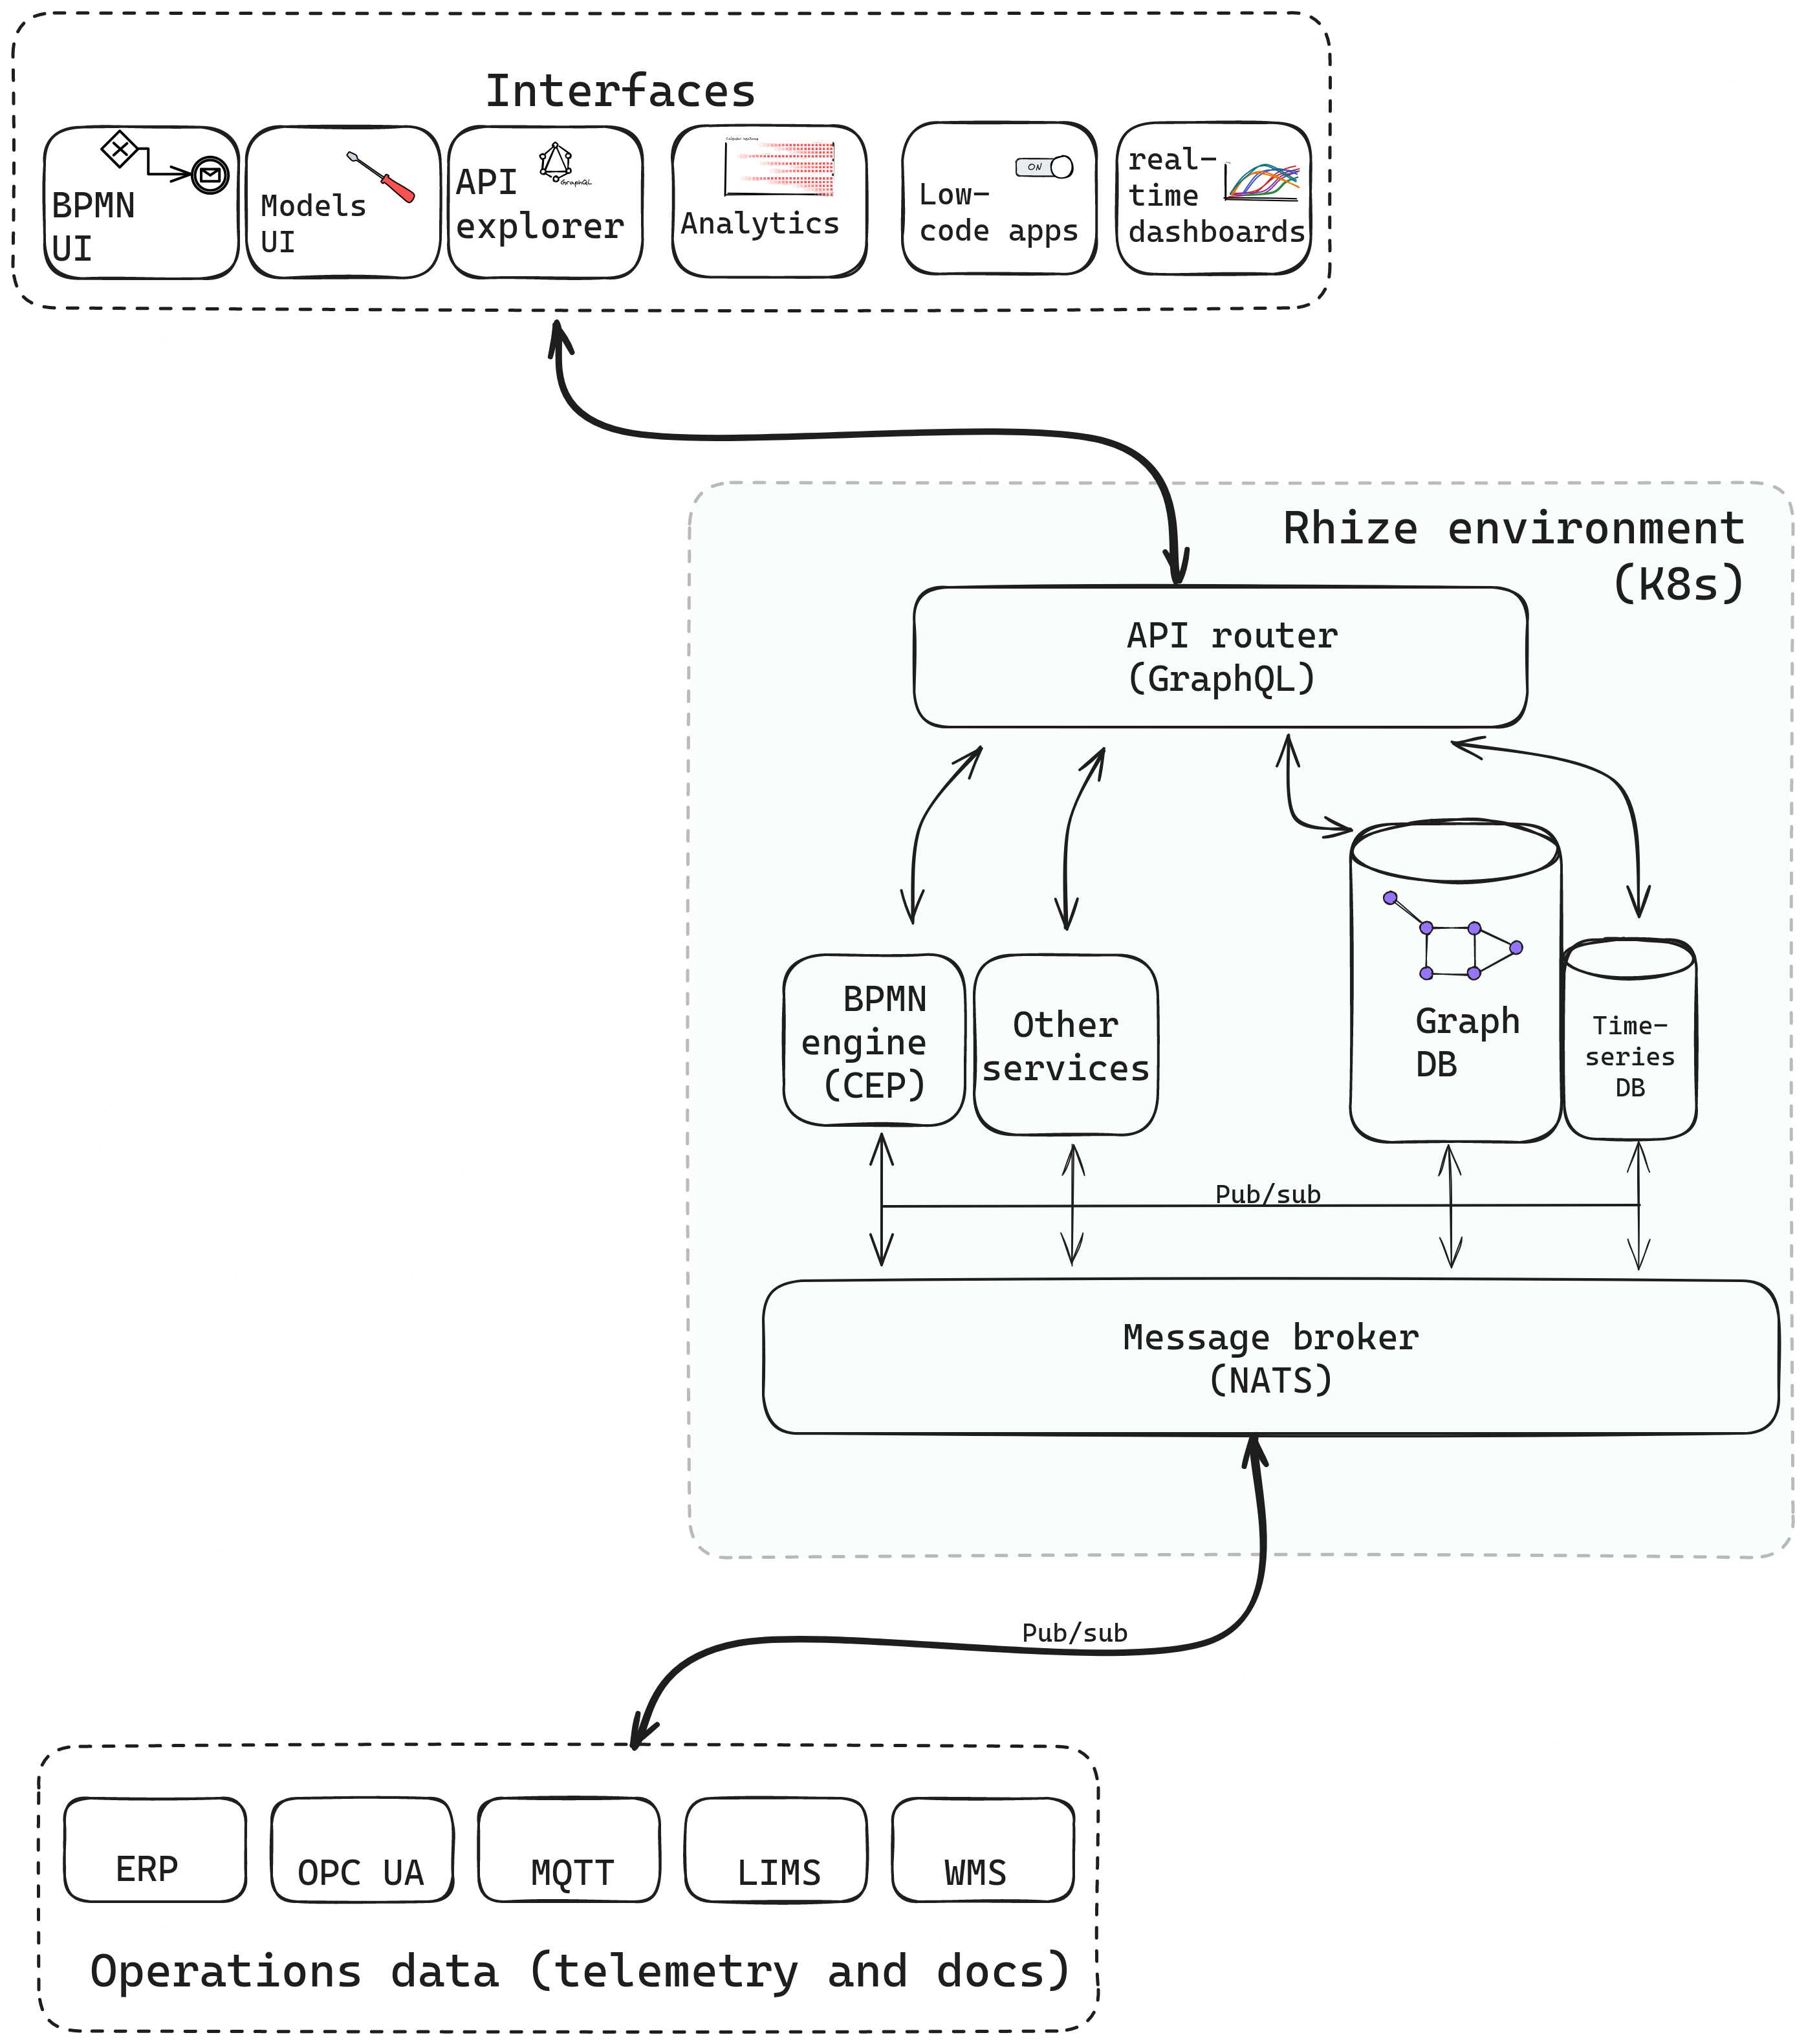
The heart of the Rhize platform is its manufacturing knowledge graph, which stores data from all levels of the operation and exposes this data through a single endpoint. Around the database are services that exchange messages and process events in real-time. The system runs on distributed, containerized systems, ensuring horizontal scalability and high availability.
Finally, outside of the Rhize deployment are the two most important components: the manufacturing operation, which sends event data to Rhize, and the Rhize users, who interact with Rhize data through a number of special-purpose interfaces.
Examples in practice
To make the next sections less abstract, consider these examples of how Rhize creates a common data hub for diverse human and system interaction.
- Data inputs
- An instrument fitter configures an MQTT-compatible device to send sensor data to Rhize.
- A business analyst sends an ERP order through an integration with the GraphQL API.
- Message exchange
- A piece of equipment publishes information about its status over MQTT.
- A Rhize Agent detects the change and publishes it into Kafka topic
TestResult. - A BPMN process subscribes to the equipment’s
TestResultsubtopic. When theTestResultstatus changes tofail, the BPMN process publishes a maintenance order to the broker. - The ERP system, which subscribes to the
maintenancetopic, prepares a document for maintenance personnel.
- Data storage
- A data scientist writes a Python script that discovers production outliers for a specific segment class across all production sites.
- A procurer uses an Excel-Rhize integration to call the API and receive a production order that the BPMN process wrote to the database one month earlier.
- User-data interaction
- An operator queries sensor values from a custom-built mobile interface.
- A quality-engineer observes real-time data in a custom dashboard built for statistical process control.
- Deployment
- A DevOps engineer pushes an upgrade that handles message-streams more efficiently. This upgrade rolls out node-by-node across each instance.
- A plant process causes a heavy inflow of data. The system autoscales to meet the temporary computation demand.
Data inputs
A manufacturing data hub is useless without manufacturing data.
The Rhize agent collects data from MQTT brokers and devices, OPC-UA servers, Kafka topics and/or Azure Service Bus. You can also send data and documents over HTTP through a GraphQL call. The Rhize UI also has a graphical interface to model production objects.
All this data is mapped to Rhize’s ISA-95 schema, which creates a coherent model for all objects in the data hub.
Message exchange
Rhize’s architecture is event-driven, low-latency, and scalable. To communicate events in real-time and across services, Rhize uses a publish-subscribe model through the Restate durable execution engine and Kafka message bus. The message infrastructure enables complex interaction between services without creating dependencies between them.
Rhize applications provide services and functions to Restate, allowing remote procedure calls in a durable fashion. Restate automatically handles failures and retries, as well as application discovery and lifecycle monitoring.
Thus, Rhize services can communicate with each other and with customer systems in a completely decoupled manner.
Data storage
With a schema defined by the ISA-95 standard, the graph database creates contextual relationships that link all data stored in the system. This graph data, accessible through a single endpoint, provides a single source to perform vast combinations of analysis.
Along with event data from disparate places and decoupled services, the database also stores declarative configuration data to instruct different services on how to respond to events.
Finally, the time-series component of the database accepts real-time data streams.
The interfaces
The Rhize application comes with a graphical interface. Some uses include:
- Configure BPMN rules. A low-code tool for analysts and operators to create programmable events.
- Upload master data. Based on the ISA-95 object models.
- Administrate. Authenticate and scope access to systems and personnel.
These interfaces sit on top of the GraphQL API gateway, which serves as a programming interface for data analysis. Rhize customers also use the GraphQL interface to build their own applications, either with dedicated frontend developers or through low-code tools like Appsmith.
Last but not least, the time-series data is also observable through GraphQL and monitoring tools like Grafana.
Deployment
Rhize runs on Kubernetes and is configured through CI/CD servers.
Using Kubernetes, Rhize can deploy to multiple instances using a common configuration. Such distribution removes single points of failure, and system upgrades can happen on a rolling basis, with zero downtime. All deployment is version controlled, which makes regressions easier to recover from.
Deployment is vendor neutral, giving organizations complete control to run the system on their local networks or preferred cloud host. The modern tools of DevOps also makes the system easier to maintain, as they come with vast tooling ecosystems and training material.